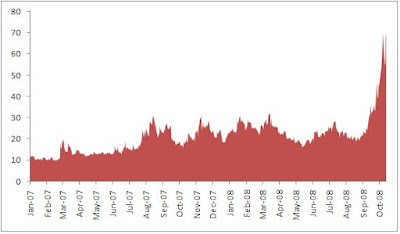
VIX has historically traded around 15-20 levels. But, in wake of recent financial turmoil, it has touched new highs of 80. More about VIX here and here.
The other graph indicates confidence in the commercial lending system of the economy. The indicator known as TED Spread is the difference between 3 month T-Bills interest rate and LIBOR. Increasing values indicate increase in counterparty risk which means banks are feeling uneasy about lending to each other which leads to increase in cost of borrowings.
TED has crossed the level of 4% after remaining in the range of 10-50 bps historically.
The above two graphs illustrates the problems faced by financial economy in general, but the last graph show a trend which speaks volumes about slowdown in real economy and aggravates the fear of recession. Baltic Dry Index as it is called indicated the level of trade done globally through the sea-route. Unlike stock market, it is free of any speculative biases. As Wikipedia puts it
“Most directly, the index measures the demand for shipping capacity versus the supply of dry bulk carriers. However, since the demand for shipping varies with the amount of cargo that is being traded in the market (supply and demand) and the supply of ships is much less elastic than the demand for them, the index indirectly measures global supply and demand for the commodities shipped aboard dry bulk carriers, such as cement, coal and grain.”
BDI is trading at 1500 levels after touching all time highs to 11,793 in may 2008. For more information on BDI, see here and here.


Crude Oil February and Brent Oil March series have gained 0.3 percent each at $ 52and $ 55 a barrel, respectively.
ReplyDeleteMCX Crude Oil tips