Friday, March 29, 2013
Weekly Market Commentary - Mar 25 - 29, 2013
Monday - Sensex down 0.50%, Nifty down 0.31%, Midcap down 0.18%
Markets stayed jittery as UPA's critical ally SP continued making noises about early elections keeping the markets nervous.
Tuesday - Sensex up 0.34%, Nifty up 0.14%, Midcap down 0.18%
Markets broke away from their recent trend of losses and posted some gains. Nothing eventful.
Wednesday - Holi
Thursday - Sensex up 0.70%, Nifty up 0.73%, Midcap up 1.52%
Markets posted a gain on the last day of fiscal 2013. Nothing eventful.
Friday - Good Friday
Friday, March 22, 2013
Weekly Market Commentary - Mar 18 - 22, 2013
Monday - Sensex down 0.69%, Nifty down 0.64%, Midcap down 0.3%
Markets ended down with not so optimistic view from RBI monetary policy review meeting next day. Broader sentiment was also negative due to Cyprus bail out plan of taxing its bank depositors made markets nervous. Moody's comments on warning on country's rating due to sustained food inflation also added to the woes of the market.
Tuesday - Sensex down 1.48%, Nifty down 1.53%, Midcap down 1.51%
DMK's decision to pull out from ruling UPA govt sent shockwaves through the market. RBI's decision to limit its repo rate cut to 25 bps and leaving CRR unchanged at 4% took the banks and realty firms down. RBI also sent a clear signal to the market to not to be too hopeful of a rate cut in the near future.
Wednesday - Sensex down 0.65%, Nifty down 0.90%, Midcap down 2.08%
Markets continued to be in red as the political climate turned uncertain. Markets were facing a real risk of early election which will put all the reforms initiated by UPA in limbo and attempts to bring down the fiscal deficit under control will have no air to breathe.
Thursday - Sensex down 0.48%, Nifty down 0.63%, Midcap down 1.22%
Markets continue to grapple with uncertain political climate, bank scandal and RBI's signal of keeping the monetary stance hawkish.
Friday - Sensex down 0.30%, Nifty down 0.13%, Midcap down 0.26%
Markets remained range bound for the last day of the week.
Sunday, November 9, 2008
Inflation conundrum
This inflation would not have been there, if there was no other source of liquidity available to this country. This change in price level has got nothing to do with the supply and demand of rice and coal but with the supply and demand of money. How much money is flowing in the market is actually the one and only determiner of inflation rate experienced by everyone. There might be few supply and demand shocks that may change the prices to drastic levels but that will be for short term as consumers will adjusts their portfolios to accommodate these changes. In the long run, it is the supply and demand of money which decided the inflation rate. As the central banker keeps on printing money, there will be more money available in the market which will lead to decline in the value of money which further will lead to every other good look expensive relative to the money.
Saturday, October 18, 2008
Indices to watch out for!!
VIX has historically traded around 15-20 levels. But, in wake of recent financial turmoil, it has touched new highs of 80. More about VIX here and here.
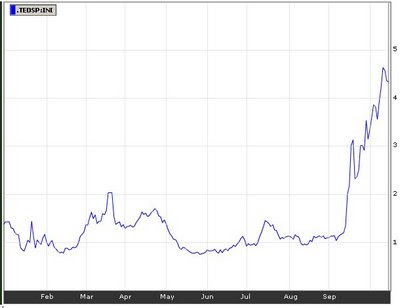
The other graph indicates confidence in the commercial lending system of the economy. The indicator known as TED Spread is the difference between 3 month T-Bills interest rate and LIBOR. Increasing values indicate increase in counterparty risk which means banks are feeling uneasy about lending to each other which leads to increase in cost of borrowings.
TED has crossed the level of 4% after remaining in the range of 10-50 bps historically.
The above two graphs illustrates the problems faced by financial economy in general, but the last graph show a trend which speaks volumes about slowdown in real economy and aggravates the fear of recession. Baltic Dry Index as it is called indicated the level of trade done globally through the sea-route. Unlike stock market, it is free of any speculative biases. As Wikipedia puts it
“Most directly, the index measures the demand for shipping capacity versus the supply of dry bulk carriers. However, since the demand for shipping varies with the amount of cargo that is being traded in the market (supply and demand) and the supply of ships is much less elastic than the demand for them, the index indirectly measures global supply and demand for the commodities shipped aboard dry bulk carriers, such as cement, coal and grain.”
BDI is trading at 1500 levels after touching all time highs to 11,793 in may 2008. For more information on BDI, see here and here.


